“Time in the market beats timing the market.”
– Kenneth Fisher
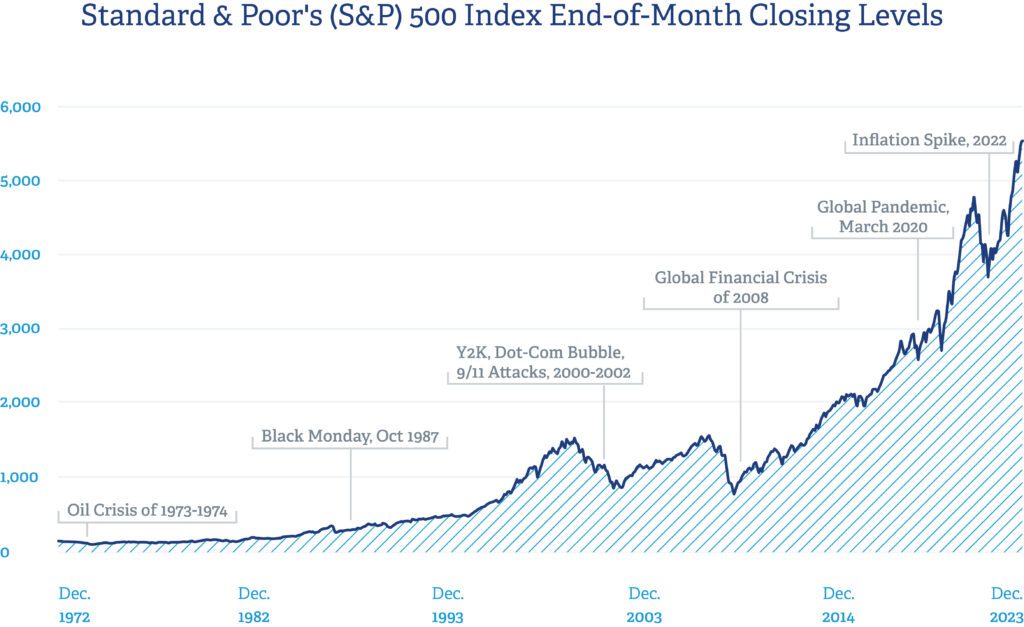
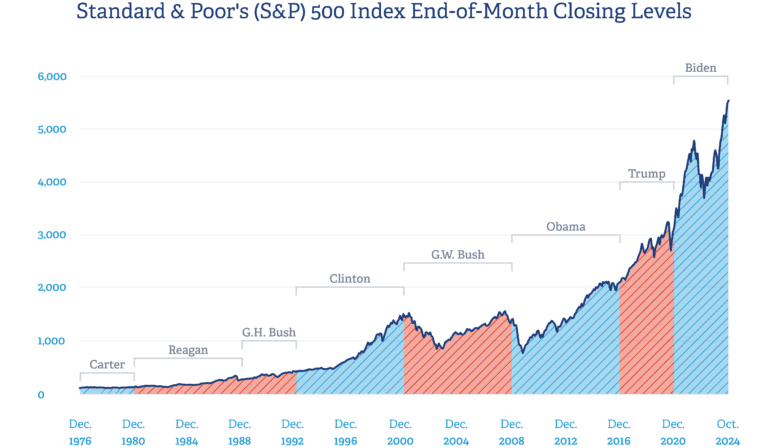
So far, 2024 has proven to be a positive year for the major U.S. stock indices. Although that is wonderful news for investors, we have had our share of ups and downs in 2024. As we navigate this most recent bout of market volatility, it is helpful to remind ourselves just how resilient the U.S. investment markets have been. Here is a list of some of the biggest market events in the last fifty years and their effect on the S&P 500.
Oil Crisis of 1973-1974
In response to a foreign aid package by President Nixon, the Organization of Arab Petroleum Exporting Countries (OAPEC) began cutting oil production, which drastically impacted the price of oil worldwide. With the sudden increase in oil prices (and other economic issues) came rampant inflation throughout the remainder of the 1970s. The S&P 500 saw a decrease of more than 48% at its worst during this period.
Black Monday, Oct 1987
On a Monday in the fall of 1987, the largest ever single-day decline by percentage in the U.S. stock market occurred on October 19. Due in part to failed hedging strategies and immature electronic trading systems, the Dow fell by 22.6% and the S&P 500 experienced a 20.5% loss, both in a single day. The S&P 500 would go on to post a total decline of more than 33% during this period.
Y2K, Dot-Com Bubble, 9/11 Attacks, 2000-2002
The early 2000s marked one of the roughest three-year stretches for the U.S. stock market since the Great Depression. It started with fears about computers being able to adjust for a four-digit year in their internal clocks. It was followed by the unsustainable run-up and eventual crash of numerous internet service and technology stocks and culminated in the attacks of 9/11. The markets would see a total decline of 49% during this three-year period.
Global Financial Crisis, 2008
The Global Financial Crisis of 2008 is widely regarded as the worst financial crisis since the Great Depression. The downturn was caused by predatory lending practices and subprime loans, excessive risk-taking by Wall Street institutions, and the bursting bubble of the real estate market. At one point, the S&P 500 was down more than 57%.
Global Pandemic, March 2020
The COVID-19 pandemic of 2020 wreaked havoc on the U.S. financial system. The swift downturn would leave investors scrambling as they dealt with lockdowns and reduced inventories of essential items. In just over a three-week period during late February and early March, the S&P 500 would lose more than 30% of its value.
Inflation Spike, 2022
To combat rampant inflation and price gouging, the U.S. government raised interest rates in hopes of curbing demand. A rising rate environment not only spelled trouble for stocks, but the bond market felt its fair share of pressure as well. Inflation as high as 9% in the summer of 2022 played a part in a downturn in stocks of more than 25% at its worst.
It is important to note past performance is no guarantee of future results. We use history as a guide to understand how markets may perform during different periods of volatility. The U.S. stock market has, time and time again, experienced volatility on the way to growing to new heights. Yet few people, if any, have been able to consistently time the market. Instead, time in the market, as part of a well-crafted financial and investment plan, remains the key to long-term investment success.
Kenneth Fisher is an investment analyst and author. He is best known for being the founder and executive chairman of Fisher Investments. For over 30 years, he shared his expertise by writing a column for Forbes Magazine. He is acknowledged as one of the most influential people in the investment advisory business.


