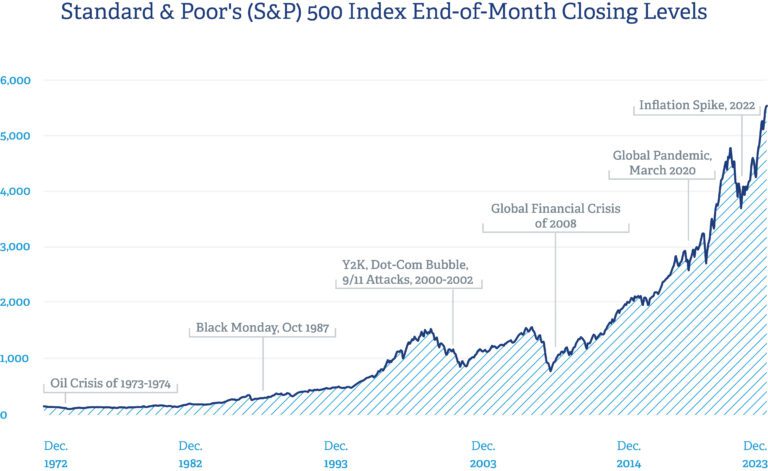
Recently, the narrative that the only investment you need is a simple S&P 500 Index fund has been gaining momentum. Comments made by Warren Buffet, coupled with inaccurate media posts, have driven this further. As long-term investors, it’s important to recognize the shortcomings of this approach.
Here are some reasons why investors need to diversify beyond the S&P 500:
1. Looking Closer at Performance
Investors might be surprised to see the results of the following three charts.
Bonds Beating Stocks
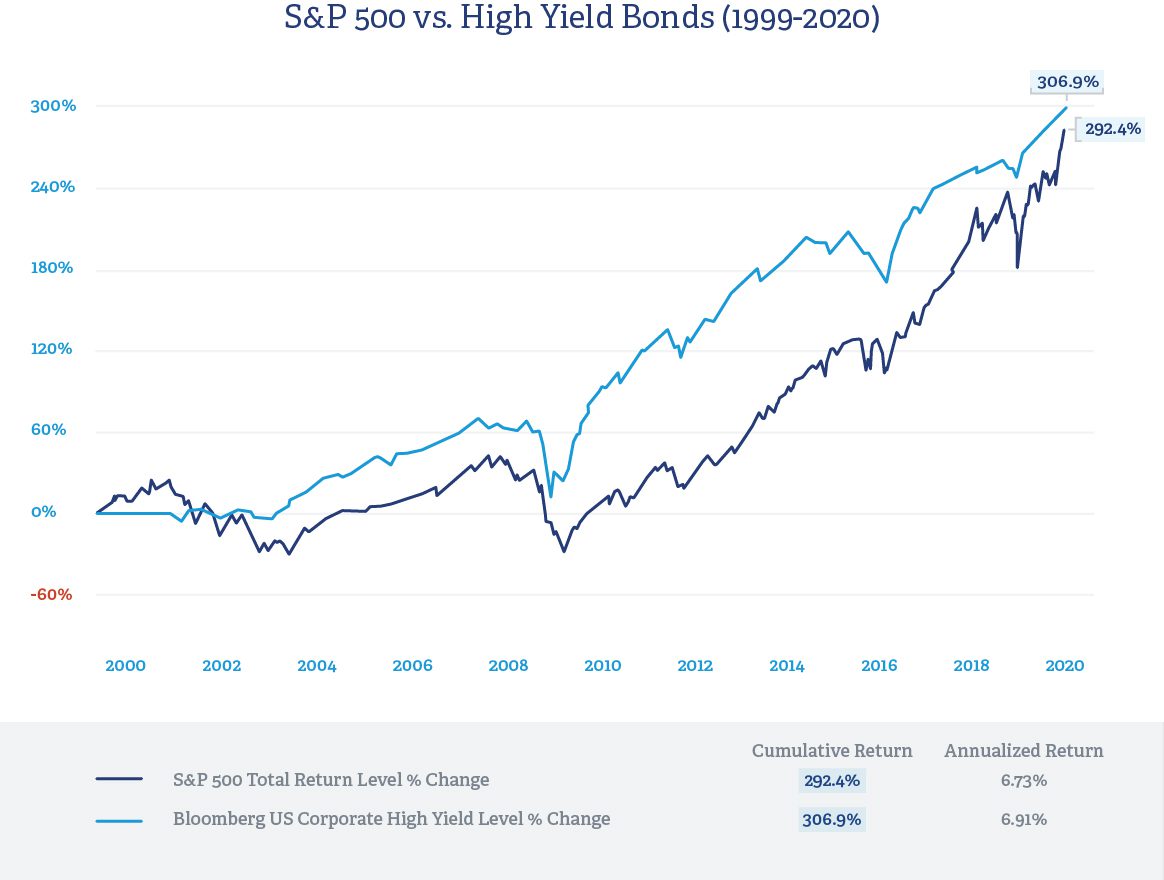
The chart below reflects a 20-year run where U.S. high-yield bonds (proxied by the Bloomberg US Corporate High Yield index) outperformed stocks (proxied by the S&P 500 Total Return index) over an extended period. We are accustomed to hearing that stocks outperform bonds, but the chart below illustrates this is not always true.
Short Time Horizon
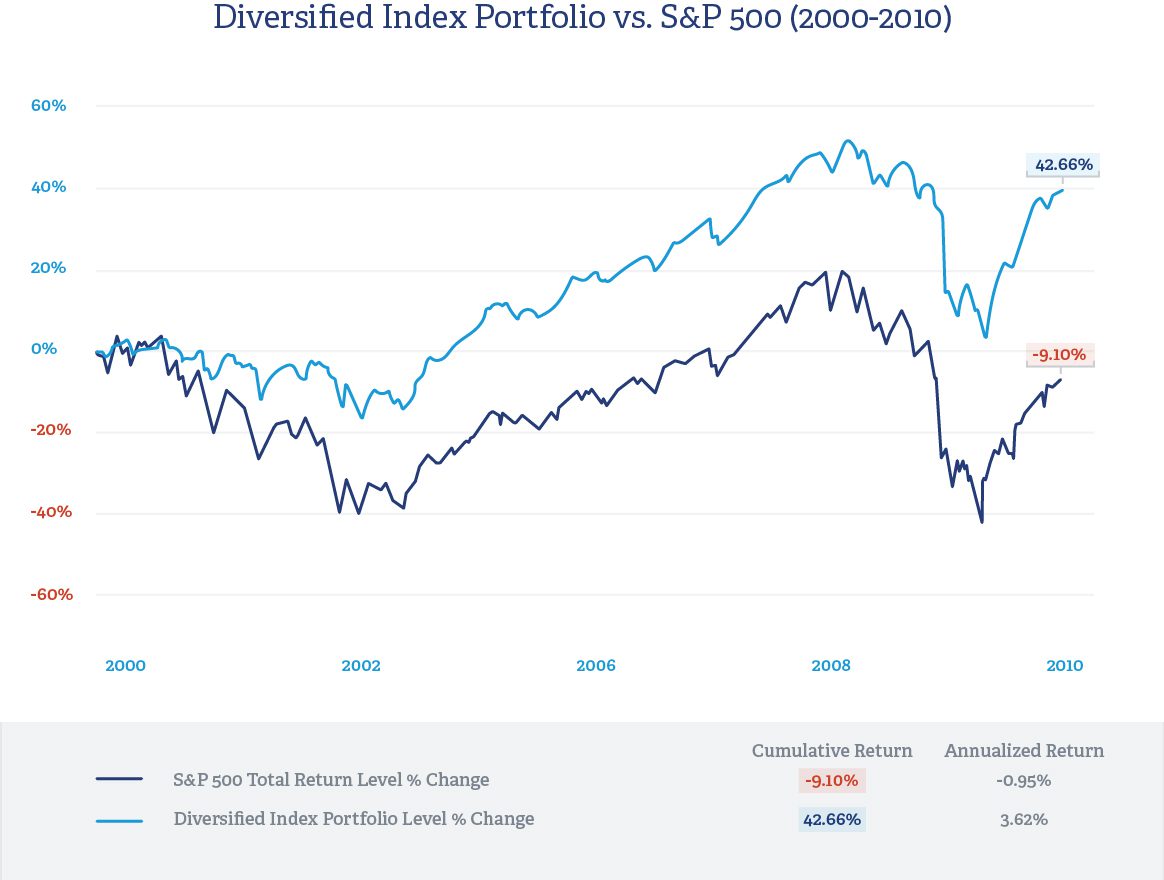
What follows next is a period that is typically known as the lost decade in U.S. stocks. Over a 10-year period, being 100% invested in the S&P 500 resulted in a total return of -9.10%, an average annualized return of -0.95%. However, an investor with a diversified portfolio including foreign stocks, small cap stocks, and fixed income (see disclosure below for indices used as proxies) would have earned 42.66%, an average annualized return of 3.61%.
Long Time Horizon
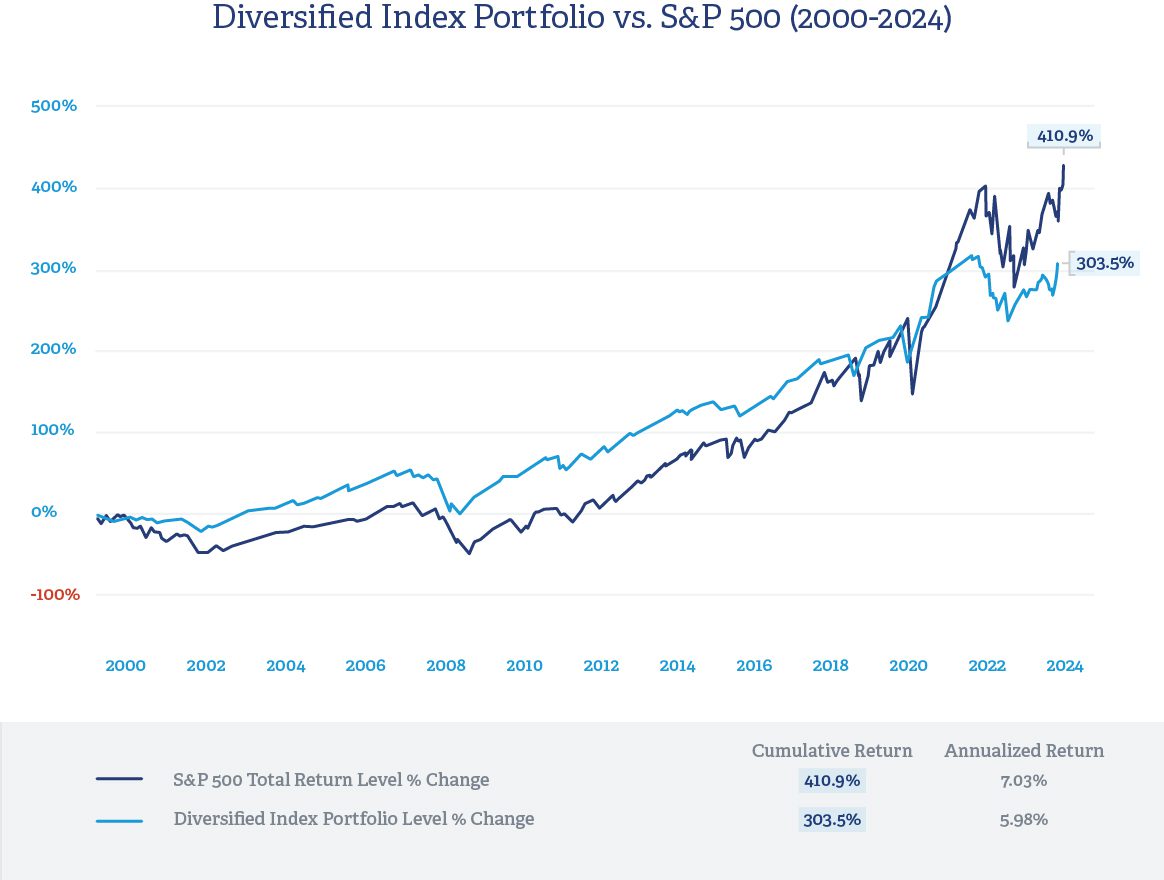
The next chart reflects a longer time horizon in which U.S. stocks slightly outperformed an investment strategy of 60% in diversified equities and 40% in bonds. From 2000 to 2024, the S&P 500 average 7.03% including dividends and the diversified strategy averaged 5.98%. However, the diversified mix achieved its return with significantly less risk.
2. S&P 500 Concentration
As of October 11, 2024, the three largest companies comprise over 20% of the index. The top ten companies make up approximately 35% of the index. A $100,000 investment in an S&P 500 index fund would concentrate $20,000 in just three companies or $35,000 in just ten. The remaining $65,000 would then be diversified over the remaining roughly 490 companies.
3. Currency Hedge
In the U.S., we have the wind at our backs by having the world’s most dominant currency. Over the last few decades, the U.S. dollar has appreciated versus most other major currencies around the world. If this trend were to someday reverse, with the dollar falling in value, those investors owning foreign investments could see those holdings appreciate. An investor that only owns U.S. stocks would not experience the diversification benefit of foreign holdings.
4. Creating Sustainable Retirement Income
Many investors hope to retire at some point, and that typically coincides with annual withdrawals from investments. The more volatile the investment strategy, the greater the risk of needing to sell investments while they are down. A diversified strategy allows investors to avoid selling investments that have declined significantly in value to provide for retirement withdrawals.
5. Risk Considerations
Here is a summary of some of the worst intra-year drawdowns for the S&P 500, going back to 1980. What is clear is that most investors struggle to stomach this kind of volatility, causing them to abandon their long-term strategy. Exposure to other asset classes can smooth this out, making downturns more manageable.
- 1987: -33.5%
- 2001: -29.7%
- 2002: -33.8%
- 2008: -48.8%
- 2020: -33.9%
It’s important to have a diversified investment strategy coupled with a comprehensive financial plan. We would all do well to avoid chasing performance and remember that investing should be viewed from a diversified, risk-managed, and goal-oriented approach.
The performance figures and charts are shown to provide a general idea of historical returns of various indices (or indexes) reflecting different types of asset classes and do not represent any account or composite managed by Regency Investment Advisors; it is not to imply that clients will obtain specific results; it is for illustrative purposes only. Past performance is not indicative of future results. Any index for which performance is shown includes the reinvestment of dividends but is unmanaged, and its performance does not include any advisory fees, transaction costs or other charges that may be incurred in connection with a managed account. Indices will include different holdings, a different number of holdings, and a different degree of investment in individual securities, industries, or economic sectors than the investment strategies used by Regency. The Diversified Index Portfolio referenced in the piece is comprised of the following indices: Bloomberg US Aggregate 40%, S&P 500 Total Return 30%, Russell 2000 Total Return 15% & MSCI EAFE Total Return 15%.


